Contents
This result page contains RNAcmap contact prediction results for your input RNA sequence. The prediction is visualized in a L by L heatmap (see Figure 1), implying the strength of the evolutionary coupling effect. The coupling signals are inferred from many homologous RNA sequences.
Effective size of the input of multiple sequence alignment is a major factor that affect evolutionary coupling models.
The top L/4 base pairs are converted to a RNA secondary structure in ct format and visualized using arc diagram. see Figure 2.
We provide the predicted secondary structure (Predicted SS by SPOT-RNA/RNAfold), the homologous sequence profile in the form of multiple sequence alignment (RNAcmap MSA), as well as the final evolutionary coupling score table (RNAcmap table) for download.
All the result files by default will be kept for at least 30 days on our server.
ID: 1234
Email: UNK
TARGET: Ha!
METHOD: RNAcmap
SSPRED: SPOT-RNA
ECMETHOD: GREMLIN
INFO: UNK
DATE: 2019-12-20 10:12:00
>reference 3Q3Z_A
GCGCGGAAACAAUGAUGAAUGGGUUUAAAUUGGGCACUUGACUCAUUUUGAGUUAGUAGU
GCAACCGACCGUGCU
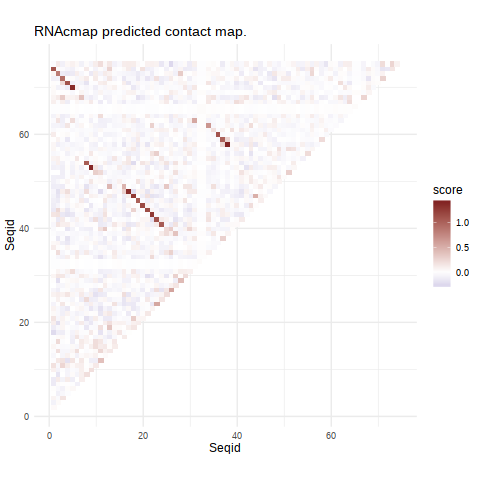
Figure 1. The heatmap showing the probability of two bases in contact, predicted by evolutionary coupling analysis according to sequence positions. Red tiles are pairs showing strong coupling signal.
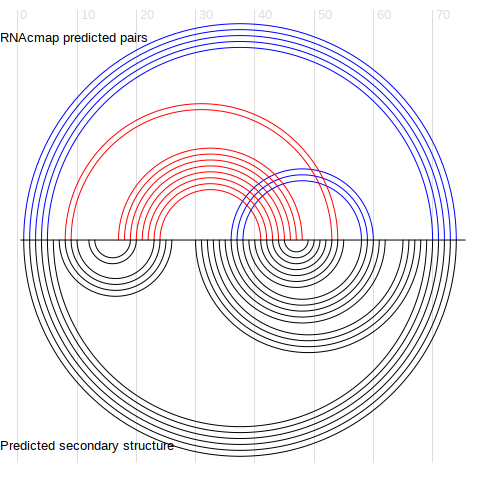
Figure 2. Base-base contacts from top L/4 RNAcmap predictions (upper half circles), compared to predicted secondary structure from the secondary structure predictor (lower half circles)
Heatmap created by .Arc diagram created by R4RNA
In the file, raw is the raw GREMLIN score. It's the root mean square of the 5 * 5 (AUGC+gap) parameters estimated by pseudo-likelihoood optimization. APC is the average product correction applied to the L * L GREMLIN score matrix.The APC column is used as the score. GREMLIN website
The RNAcmap generated multiple sequence alignment (MSA) file uses the A2M alignment format, a small modification of FASTA format and is compatible with most tools that read FASTA. [Source]
CT (Connectivity Table) format contains secondary structure information for a sequence. Briefly,
the first line has the number of bases and the title of the structure. Each of the following lines provides information about
a given base with the following six columns: [Source]
| Base index n | Base | Index n-1 | Index n+1 | Index of paired base | Natural numbering |
|---|---|---|---|---|---|
| 1 | G | 0 | 2 | 94 | 1 |
| 2 | C | 1 | 3 | 73 | 2 |